PART 1: THE INERTIA OF WRONG ASSUMPTIONS
An object at rest tends to stay at rest…
Newton’s First Law
I’ll never forget the reactions of those two physicians, those many years ago. Or, at least I won’t let myself. Not yet at least.
Allow me a moment to retell.
It was about seven years ago and I had just given a talk at a regional meeting in the Midwest. This particular audience was made up of medical dosimetrists and radiation therapists, with a smattering of medical physicists and radiation oncologists. My topic: “Variation in Anatomical Contouring.”
One of my first slides was a clumsy cartoon I had sketched together in PowerPoint. It showed a horse (labelled “treatment planning”) pulling a train of carts, each labelled with a specific technology dependent on the preceding one. And under the horse, representing the road on which the horse and all carts depended, was written one big, bold word: CONTOURING. I found that old cartoon and I’ve reproduced it in Figure 1, below.

Figure 1. My slide (circa ~2010) used to say, essentially, “We can talk about the cart and the horse all we want, but let’s not forget the condition of the road…”
My simple argument was that if you don’t get your anatomy volumes defined correctly – both for targets and critical organs – then everything else downstream suffers. Or, following the horse-and-cart metaphor, inaccurate contours make for a really bumpy ride. All the benefits of the elegant technology of radiation therapy – inverse planning and dose optimization, dose calculation, DVH and other plan metrics, image-guidance, and precision delivery – don’t even matter if your patient anatomy blueprint is wrong in the first place. The anatomy contours are the original “design input” to the personalized medicine that is radiation oncology. Get that wrong, and you’re in trouble.
For the talk, I showed some preliminary data on inter-observer anatomical contours over a range of critical organs. These were controlled experiments where all clinicians were given the same CT images, and the variation I was seeing in some organs was shocking. While there was not much variation for some organs like the brain or lung which are easily seen as clearly defined pixel regions, there was very large variation for many other organs like the parotid, sub-mandibular glands, brainstem, larynx, and even the spinal cord (!). The anatomy contours drawn by one clinical professional could be vastly different than another’s, all else equal. Well, it’s safe to say, that’s not a good thing.
During the talk, one physician in the back of the room seemed to grow a little agitated, and after the talk he raised his hand and commented something to the tune of, “So what. That’s what margins are for. Contouring mistakes don’t end up mattering.”
And after the talk, another doc (who was not at the meeting, but who heard about the talk) relayed via email that he didn’t think there was much variation and the study was a waste of time. His argument was that dosimetrists are trained on anatomy during school and must pass tests required for certification.
Two different radiation oncologists, two opinions: one that contouring variation doesn’t matter in the big picture, and another that the variation doesn’t really exist in the first place.
When wrong assumptions become wrong opinions, they tend to stick around. This is especially true if the status quo is comfortable. Or profitable.
PART 2: DR. WRONG, MEET MR. RIGHT (a.k.a. Data)
“Without data, you’re just another person with an opinion.”
W. Edwards Deming
Within a year of that talk, my colleagues and I finished that project and soon thereafter it was published in the ‘Red Journal’ (IJROBP).
The paper clearly rebuked any argument that there is no significant variation in organ contouring. As it turns out, there is large variation, even in the focused population of the experienced, highly-educated folks for whom anatomy contouring is a primary job responsibility. (Note: This variation is supported by many peer-reviewed medical articles published both before and after ours.)
The paper also clearly disproved that assertion that, even if there is variation, that it has no dosimetric consequences. (Now, of course this argument is ridiculous on its face, but remember this is not a “straw man” argument that I’m just propping up to make a point. No, this is a “real doc” argument.) In this particular head and neck study, we found substantial dose differences resulting strictly from contouring variation. These differences ranged from –289% to 56% for mean OAR dose and from –22% to 35% for max OAR dose.
Those are significant numbers. And bear in mind that there is no technology – no new optimizer, no auto-planning method, no new linear accelerator or MLC or proton therapy, no on-board imager, no anything – that can correct for errors in target and OAR contouring made during the planning process.
PART 3: FANCY, NEW TECHNOLOGY TO THE RESCUE? NOT SO FAST.
“We are being ruined by the best efforts of people who are doing the wrong thing.”
W. Edwards Deming
Our industry is always trying to solve problems with expensive new technology. Sometimes it works. Not in this case, or certainly not yet.
For example, some may say that auto-segmentation, i.e. letting a computer algorithm delineate critical anatomy, will remove variation from contouring. That’s partly true, but the truth matters, and the truth is that auto-segmentation is not particularly accurate, especially on CT images. In fact, for many organs, it can be downright inaccurate. Put another way: sure a computer can give consistent answers, but they may just be consistently wrong. Removing variation alone is not enough; we must remove variation while increasing accuracy.
(As an aside, here’s a thought to for the auto-segmentation software vendors: stop releasing new software without hard evidence that works. And by “works” I mean: it produces higher accuracy and less variation than the most skilled clinicians. Also, bring empirical evidence. Deal?)
As another example, some purport that MR-simulation, i.e. MR-based planning, is a good cure for contouring errors. There is some merit to this argument (though certainly MR is not a cure-all), but there is also reality. And the reality is that replacing CT with MR for treatment planning is not going to happen overnight, and may ultimately only be warranted a certain subset of cases. Not to mention that compared to CT, MR is expensive. Very expensive. But most importantly, we must remember that trained humans still have to contour on the MR. (Hey, maybe it’s time to do repeat the variation studies using MR images! We’ve already started…and guess what? There’s variation.)
PART 4: TOOLS FOR PROFOUND KNOWLEDGE
“There is no substitute for knowledge.”
W. Edwards Deming
The solution is clear, if we only take off our CPT-code-colored (tainted?) glasses and use common sense. Simply put, we can improve accuracy, and remove variability, in contouring by investing in the training of the skilled individuals who do the work.
And in fact, this is our goal of ProKnow’s Contouring Accuracy Program (CAP), which we have based on Deming’s System of Profound Knowledge (Profound Knowledge = Pro + Know = ProKnow…see what we did there?).
The ProKnow CAP puts standard datasets in a cloud-based interface for contouring. For each critical structure, we post basic refresher course materials for viewing and download, and then members can contour (using tools, right there on the web, no need to transfer data to your planning system or contouring software) each structure.
After the first contouring attempt, a video “walkthrough” with an expert physician is posted, explaining basic strategies for how to find the superior border, inferior border, and detailed explanation of how to delineate the structure on each CT or MR axial slice. The user can then re-do and practice the contouring as often as they want to hone their skills. After each attempt, a StructSure accuracy score2 and Dice Coefficient are shown, as well as visual and clear and interactive graphics showing where there was extra, missing, and matching regions. See Figure 2, below, for an example.
And now, so that our users can really appreciate, quantify, and visualize variability. We have just added population statistics and consensus contouring visualization to the toolset! Just sign in, navigate to the “Contour Accuracy” module, pick any of your structures that you have contoured at least once, and now you will find a “Population Results” tab. On that tab we now show you: 1) histograms of StructSure scores and Dice Coefficients (for both initial and latest contours, by the entire population of members), and 2) interactive consensus contours as frequency “clouds” underneath your (and the expert’s) contours.
See Figures 3-6 for examples of these cool new tools. In these figures, the left panels show histograms of contouring accuracy scores for the initial contouring attempt (upper panel; high variation, including some “zero” scores) vs. subsequent attempts (lower panel; much lower variation, including many more high scores). The right panels show 3D frequency clouds (i.e. color maps of voxels contoured across many observers) for the initial (upper) vs. subsequent (lower) attempts. The cloud shrinks to match the expert contour in all cases, which is shown as a yellow line over the frequency cloud. As you might suspect, variation decreases and accuracy increases when professionals get useful tools for accuracy assessment and expert training.

Figure 2. Objective scoring and visualization of the brachial plexus, contoured on CT.

Figure 3. Variation in contouring the submandibular gland, shown by histograms of accuracy scores (left panels) and 3D consensus frequency grids displayed as hot-cold color maps (right panels).

Figure 4. Variation in contouring the brainstem, shown by histograms of accuracy scores (left panels) and 3D consensus frequency grids displayed as hot-cold color maps (right panels).
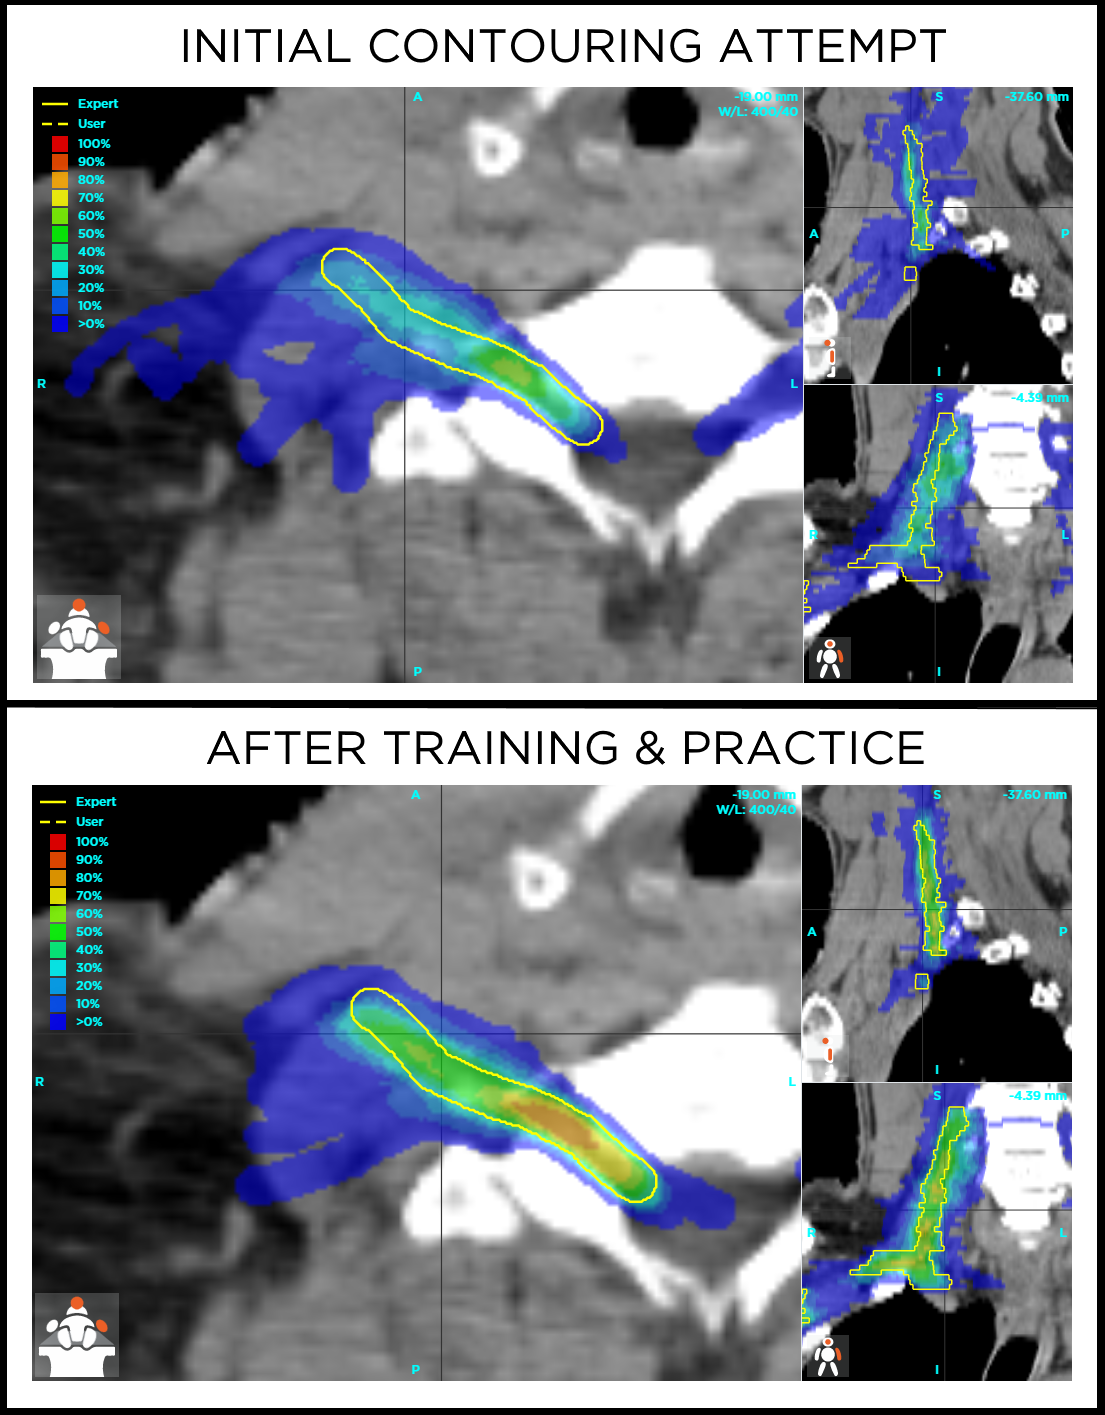
Figure 5. Variation in contouring the brachial plexus, shown by histograms of accuracy scores (left panels) and 3D consensus frequency grids displayed as hot-cold color maps (right panels). This is a very difficult structure to contour, as evidenced by the continued variation even after some training and practice.
PART 5: SOMEDAY
“Honesty is the best policy – when there is money in it.”
Mark Twain
Today, in the fee-for-service healthcare model of the United States, there is not yet a financial incentive for proving that you produce high-quality, accurate contouring. Likewise, there is no penalty for inaccurate contouring. Payment is made in large part due to what technology is used along the way, with no link to the objective quality of the personalized medicine or outcomes for the patient.
That’s a real shame, but this will change. Someday. Hopefully soon.
Someday, health care payors will learn that they’re paying largely for whatever expensive planning techniques and treatment machines are used per patient, but that no machine or technique can make up for inaccurate contouring. Someday, organizations will realize that proof-of-competency in contouring should be required for certification of any individual and credentialing of any hospital or clinic. Someday, department administrators will invest (at low cost) to optimize their staff’s practical skills, just like they invest (at high cost) in new imaging, planning, and delivery devices. Heck, someday patients themselves might be aware of the issue, and demand to see the contouring track record of their providers.
It all leads to here, to the “someday” when high performance will be required, proven, and rewarded; or, back to the metaphor, when both as an industry and as individuals, we dedicate ourselves to fix the potholes and straighten these roads.
When that day comes, the horses and cars will work better as a result. And our patients will reap the rewards.